History of early settlements and population
The region that we know as modern day Italy is filled with an interesting past. From the Renaissance to the Roman and Greek empire, Italy has been a rich area full of art and culture from different parts of Europe and around the world. Today, I will be talking about why this region in specific was such a perfect place to settle down in. As well as why this landscape was able to support multiple empires for thousands of years.
Historians believe that the region that we know as modern Italy today, was first settled by not one whole empire but by a set of different tribes that came from different parts of Europe. The two main tribes that settled in the region were the Indo-Europeans, who came in by land from the North. Indo-Europeans spoke a subgroup of languages known as “Italic”. The second group was called the Etruscans. They were believed to be the dominant out of the two groups. For the most part these two groups were spread across the land as small farming villages; it wasn’t until the rise of the Greek empire in 800BC that these villages united into one.
I believe that Italy was a great place for settling down because of its geography and climate. In the northern parts of the country, you can find stunning mountain ranges; in the wintertime there are heavy snowfalls in the north. And winter typically lasts from December to March. Summertime in the northern parts of the country is perfect for farming. There is an abundance of water due to the melting snow from the mountaintops that creates larger rivers, that and its fertile soils help farmers greatly because the northern part of Italy is where most of its produce comes from. The central and southern part of the country shares a similar climate being that it’s close to the Mediterranean Sea. The weather there in the summer time is humid and hot. People back then and even now benefit from living there because having access to the ocean doesn’t only mean that they have a reliable source of food, it also means that there is a lot of trade that can be done within other groups of people across the Mediterranean.
The resources that Italy’s landscapes had to offer in its beginning years of settlement ranged from agricultural to raw natural recourses. Like stated before the northern part of the region offered large fertile flats that were perfect for harvesting crops. The mountain ranges in the north also offered protection to the villages above by providing a natural barrier. The south was perfect for trade due to it being located by the Mediterranean Sea. Many ports were built here and it made it easy ship and receives natural resources from other neighboring territories. The sea also provided its people with an abundance of fresh seafood.
The problems that early settlers faced in this region were threats from other tribes who were constantly trying to invade. Being that it was such as perfect place to thrive, there was always threats from the outside, this made it hard for civilizations to rise but not impossible. When the first the first unification of tribes happened it marked the beginning of the Greek Empire. This was a result of city-states forming into one republic. Unity provided protection for the people, for their values, and for their beliefs.
HISTORY OF ITALY. (n.d.). Retrieved January 28, 2017, from
http://www.historyworld.net/wrldhis/PlainTextHistories.asp?ParagraphID=efw
History.com Staff (Ed.). (2010). Ancient Greece. Retrieved January 28, 2017, from http://www.history.com/topics/ancient-history/ancient-greece
Italy Weather, climate and geography. (n.d.). Retrieved January 28, 2017, from http://www.worldtravelguide.net/italy/weather-climate-geography

This picture illustrates the geography of Italy. You can see how the Alps mountain range provides a natural barrier in the north. The Northern part of Italy also has flat plains that offer space for growing crops, as well as the Po River that runs from France to the Adriatic Sea. The map also shows the southern part of the region. Like previously stated the southern part of the region was perfect for seaports and trading posts.
Europe. (2015, November 17). Retrieved January 29, 2017, from http://www.worldatlas.com/webimage/countrys/europe/lgcolor/itcolor.htm

This is a graph that shows the average weather throughout the year. The coldest months are December to February, The hottest months in Italy July and August. This is important to know because we get an idea of when early settlers would go out and plant their crops.
Italy Climate And Weather. (n.d.). Retrieved January 29, 2017, from http://www.keyword-suggestions.com/aXRhbHkgY2xpbWF0ZSBhbmQgd2VhdGhlcg/
Italy Climate And Weather. (n.d.). Retrieved January 29, 2017, from http://www.keyword-suggestions.com/aXRhbHkgY2xpbWF0ZSBhbmQgd2VhdGhlcg/
Recommended links
http://www.history.com/topics/ancient-history/ancient-greece
http://www.infoplease.com/country/italy.html
http://www.infoplease.com/country/italy.html
Population Pyramids
|
|
|
What shape type is this pyramid?
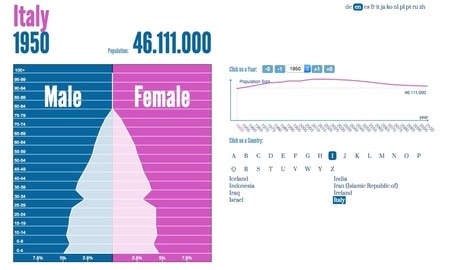
Pyramid 1 shows Italy's population in 1950, and this pyramid is shaped like a Christmas tree. There are three parts to a population pyramid, the "Pre-reproductive" stage which is typically found on the bottom of the pyramid and includes ages 0-14.Then you have the "reproductive population" which is found in the middle of the graph and includes ages 15-44. last you have the "post-reproduction" group which is found at the top of the graph, this includes ages 45+. What does the shape say about the distribution of the population? The shape of this population pyramid indicates that there was an increase of babies in 1950, this could have been a result of the baby boom that happened after world war 2. The shape of pyramid 1 predicts tat there will be a population increase in Italy in the years to come, due to the amount of the pre-reproductive population. Which age group has the highest percentage of the population? The age group with the highest population in pyramid 1 is the "Pre-reproductive" age group 0-14. Which age group has the lowest percentage of the population? The lowest age group of the population in pyramid 1 are the "Post-reproductive" age group, ages 45+. Are there any usual/interesting anomalies in the pyramid? Pyramid 1 shows how the population increased after the war, and how Italy's population will see a steady increase in people in the years to come after WW2. |
What shape type is this pyramid?
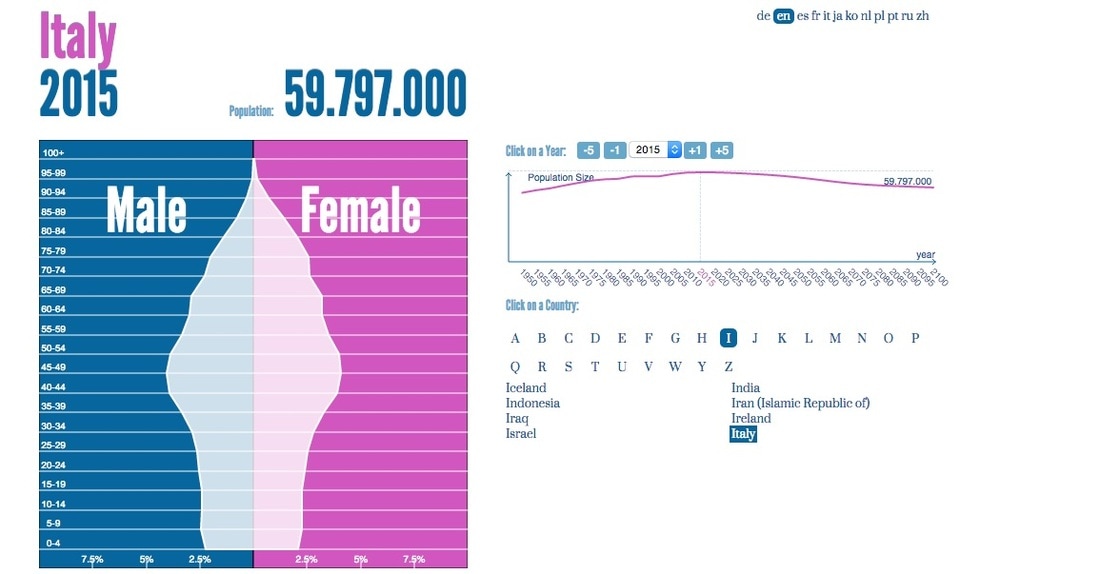
Pyramid 2 shows Italy's population in 2015, this population pyramid is shaped like a cup What does the shape say about the distribution of the population? The shape of pyramid 2 indicates that there will be a population decline in Italy in the years to come. this could be because Italy is getting further along into industrialization. These are strong signs that factors like education are beginning to have an effect on household sizes because people are now beginning to educate themselves on safer contraceptive methods. It could also be that the reproductive population understands that a higher education such as a college degree can benefit them more in the long run, leaving the choice of reproducing early on pause. Also as social views begin to change, so do gender roles, a decrease in birth rates could show that women are beginning to focus on other opportunities such as education or work, rather than starting a family. Which age group has the highest percentage of the population? The age group with the highest population in age in pyramid 2 is the "Reproductive" population ages 15-44. Which age group has the lowest percentage of the population? The lowest age group in pyramid 2 is the "Pre-reproductive" age group, ages 0-14. Are there any usual/interesting anomalies in the pyramid? Italy's decline in population will occur in a slow manner, it is interesting to see how social changes have affected population growth and how gender roles are beginning to change as newer generations are born. |
Conclusion
As I analyzed these two pyramids I began to realize that as countries took steps forward into becoming more developed, the population grew very steady, or in some cases decreased. this comes to show that in order for a country to flourish they must have a healthy economy, proper agriculture to support its people, and advanced medicines to control diseases. in pyramid 1 we are able to see that life expectancy wasn't as far as life expectancy in pyramid 2. this is due to the medical advancements humans have made since the 1950's. we can also see that the "reproductive" Ages are low in pyramid 1 because of all the people in Italy who were killed during WW2. Another thing that we can see is how reproduction becomes steady or begins to decrease the more a country develops. this could be due to the fact that as younger generations begin to acknowledge the power of education, the put family planning on pause.
